A deep understanding of the application assets to maintain, transform, update or migrate
However, analyzing millions of lines of code written in various legacy languages is a long and tedious task. Cobol, PL1, Rexx, CSD, ASM, BMS, RPG, RPGLE, PowerBuilder, Natural, etc. are not point-and-click technologies.
There is a need to identify the application architecture, identify entry points (start of transactions, batch chains, data access, and mode access...), identify direct and indirect dependencies through data, calls, identify main programs, isolated programs, dead code, static and dynamic calls, etc.
Unless you get hands-on experience with each of those parts in a concrete use-case context, the climb will be steep.
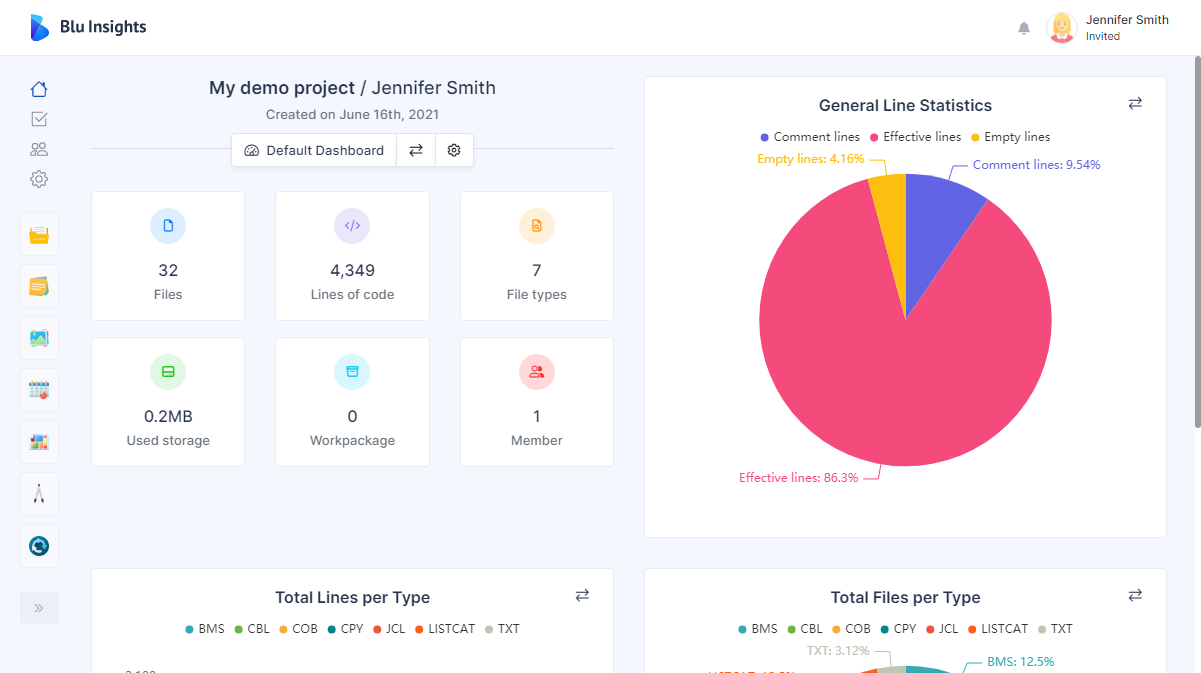
AWS Blu Insights is built to automatically process millions of lines of source code
This allows to discover the main metrics of large and complex source code portfolios and understand

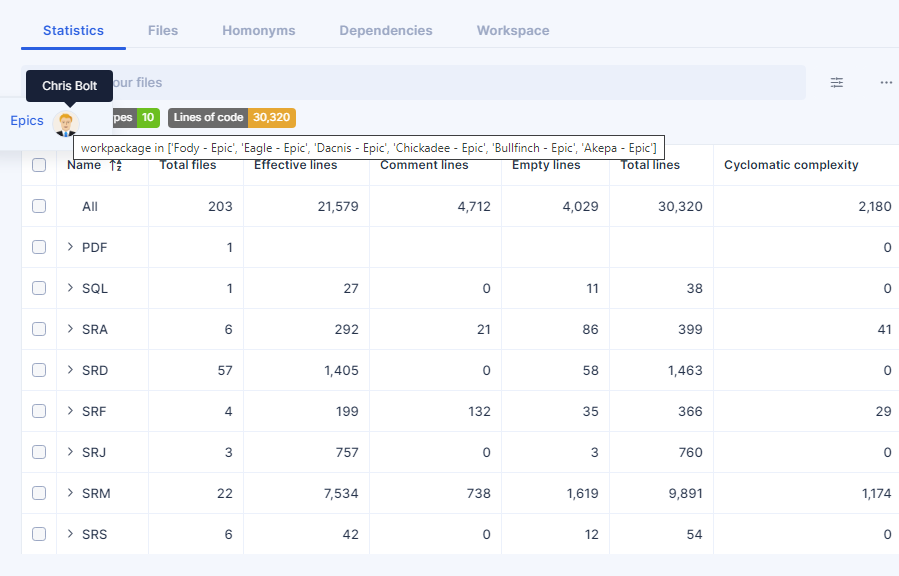
Percentages of file types and categories of line codes.

Cyclomatic Complexity per file and per technology.

An interactive graph-based Dependencies analysis.
The results are presented in different formats for better visualization. They can also be exported to personalized Excel files. Multiple options allow the user to customize the content by filtering, sorting, and grouping.
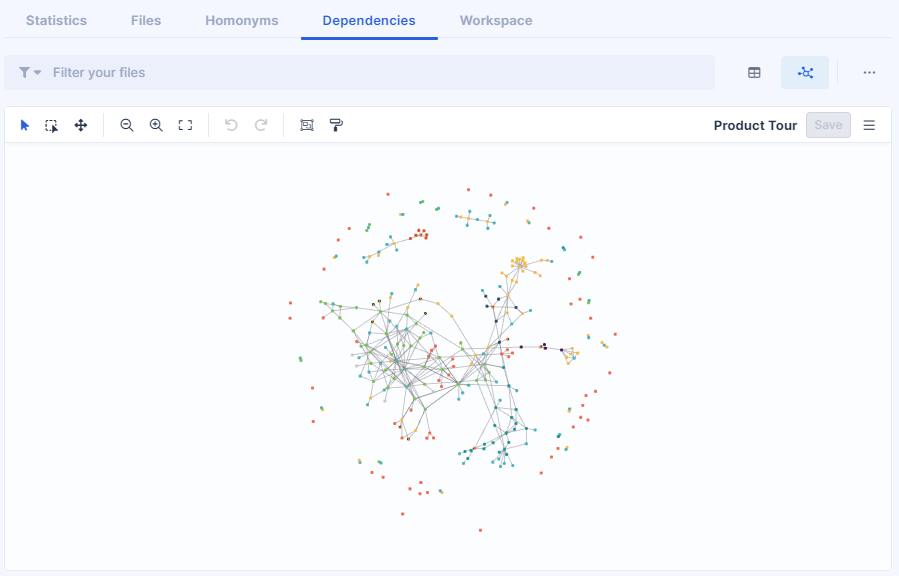
AWS Blu Insights results are tangible outcomes
AWS Blu Insights results are tangible outcomes allowing a deep understanding of the assets portfolio (NOT only an overview) in order to make sure your portfolio is complete (no missing programs), decompose your application into independent or interconnected modules, compute software engineering metrics (volume, complexity and cyclomatic complexity), solve deployment dependencies (data common to programs in different modules, coupling the data), classify programs by pathology: no pathology or benign, hard to test, hard to maintain, to be redesigned, get data (files and tables) for each program, etc.

A list of identified programming languages and technologies.

The number of lines of code per file, per type, per folder, and per path.

The number of commented lines and empty lines.
Sharpen your analysis with AWS Blu Insights Query Language (BQL)
Human readable & understandable query language.
