Dependencies feature is the starting gate to visualize and decompose codebases by technical and functional domains. Graphs, which are the fruit of the analysis, accompany customers on their journey of assessment by providing helpful tools such as visual preferences. One way to illustrate the relationships between business domains and visualize components in the graph is by using colored containers to represent nodes with the same Workpackages or Labels.
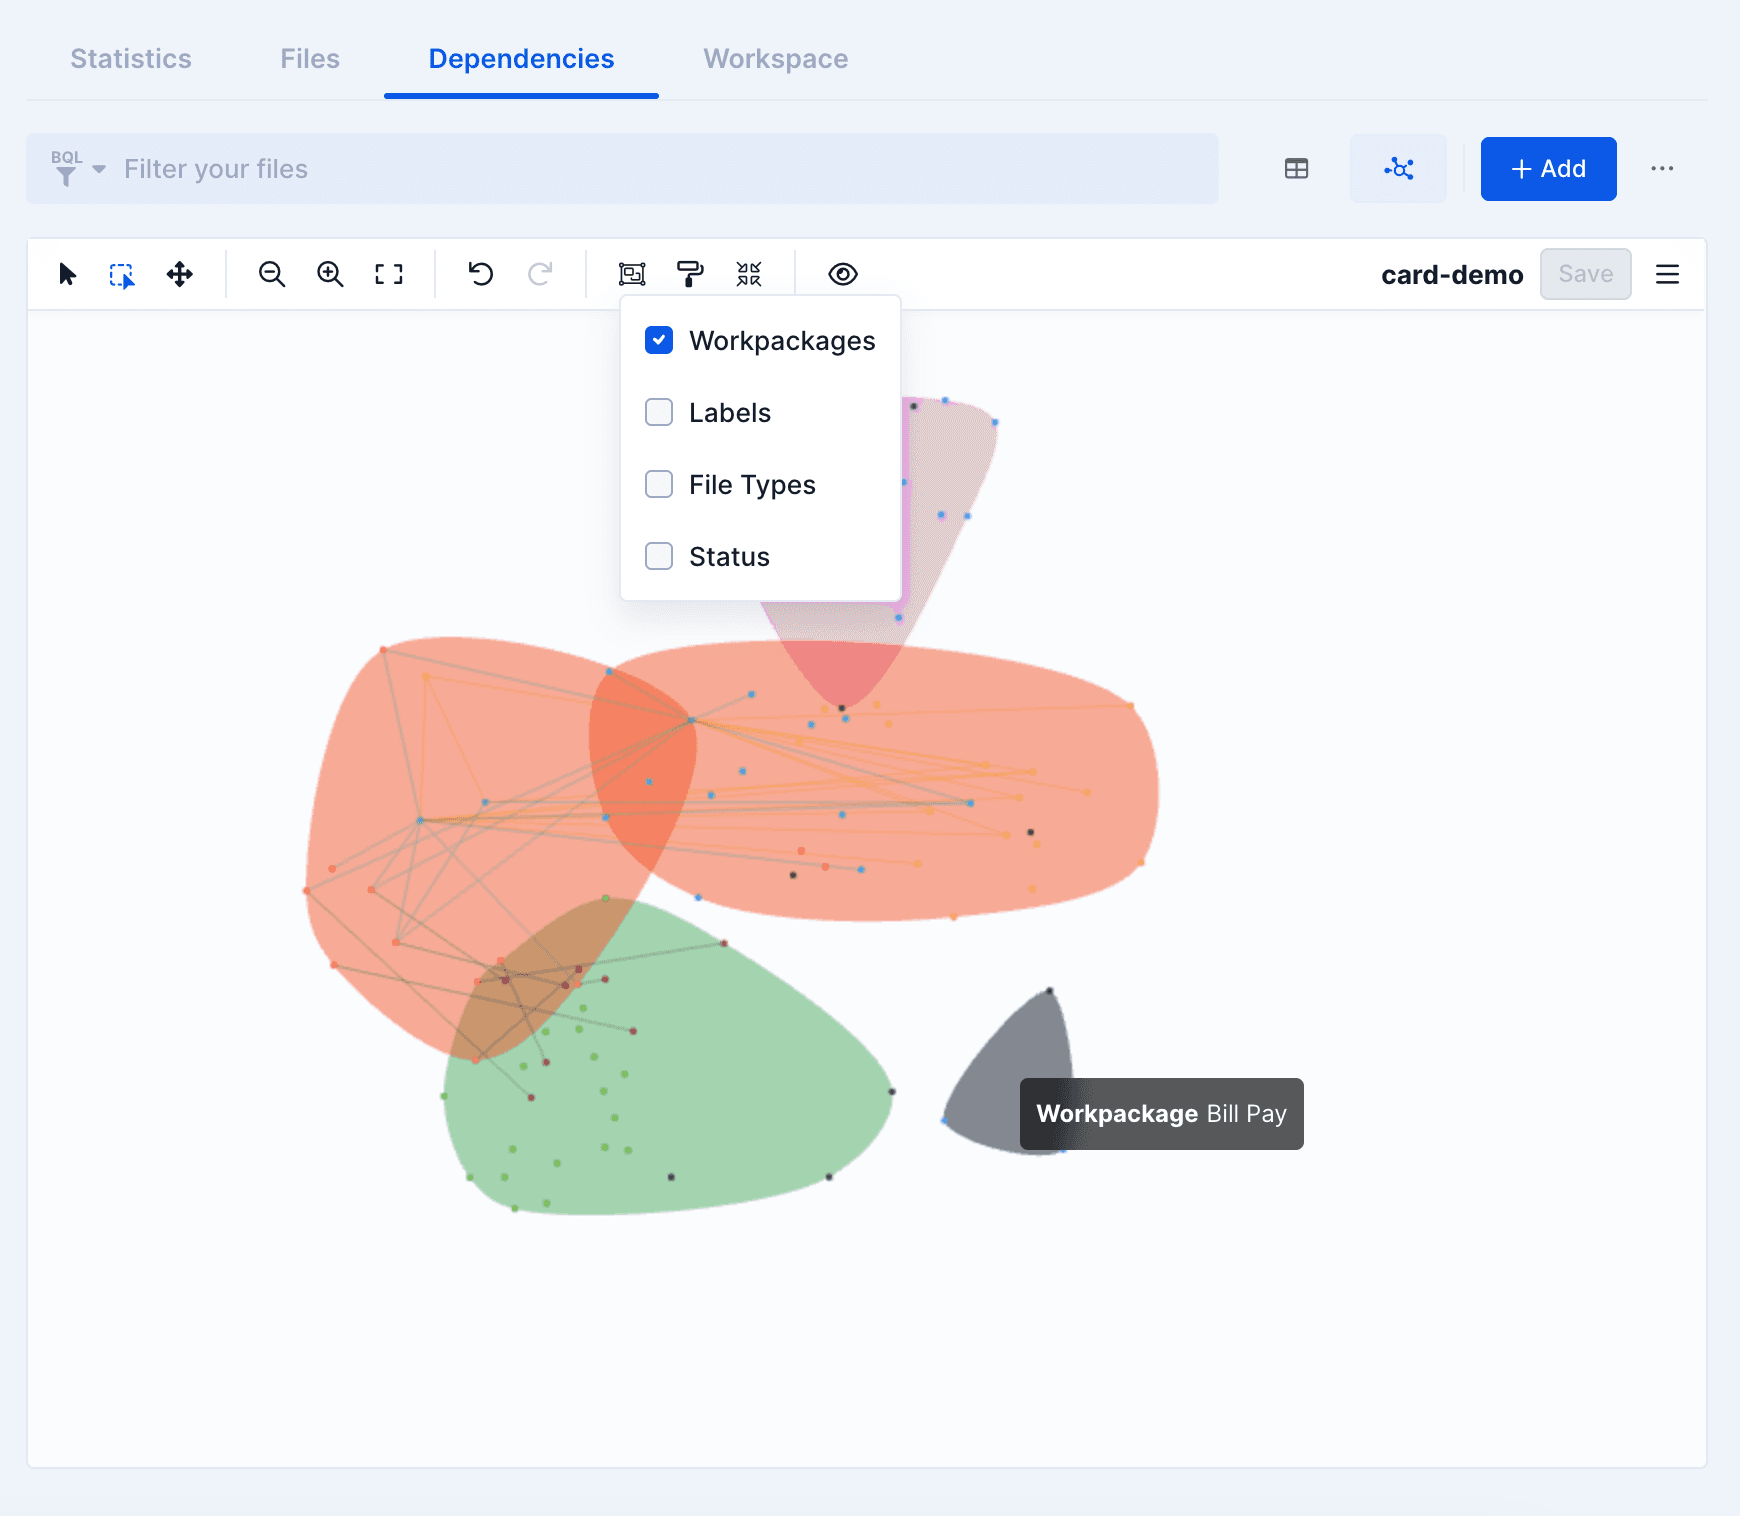
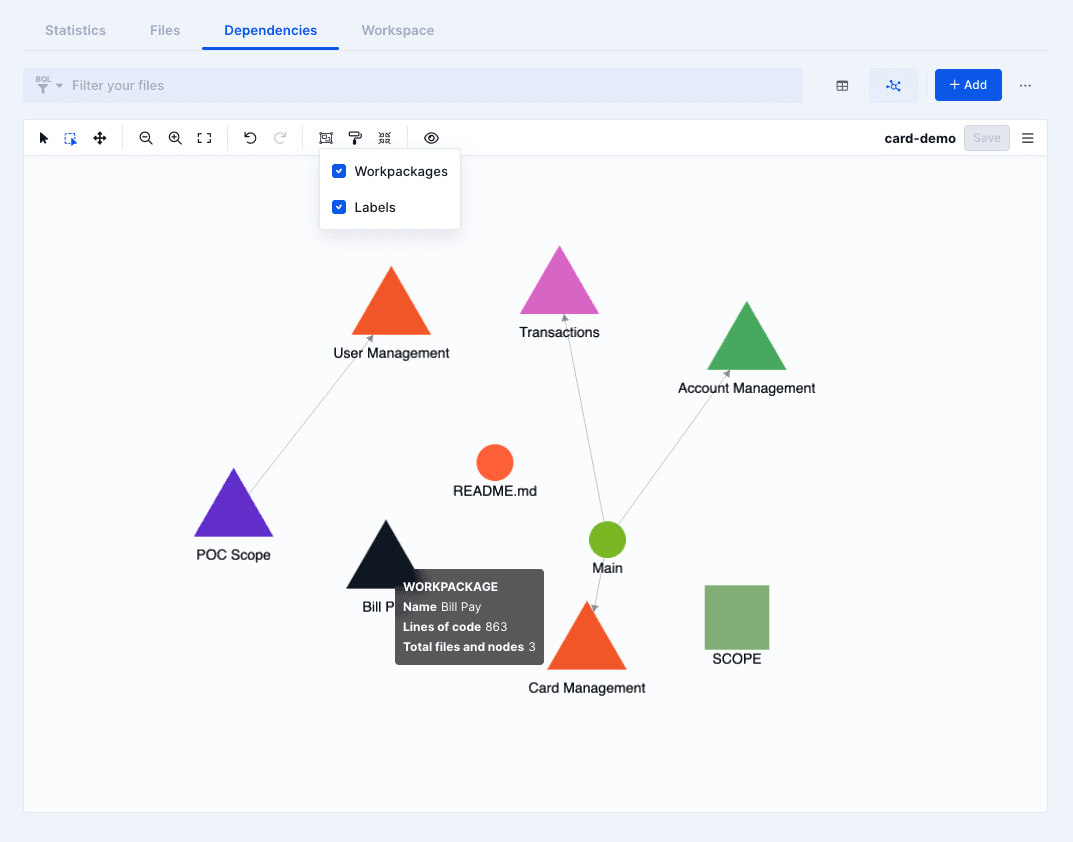
We wanted to go further and enhance this feature by introducing nodes groupings (aka Hypergraph) 🎉. This new capability allows to group/ungroup nodes that belongs to the same workpackage or label and visualize them as single nodes. Nodes that belongs to multiple workpackages/labels will be ignored during the grouping.
With this feature, customers will:
- easily navigate and read condensed graphs as it reduces the number of nodes
- identify nodes and programs more rapidly
- merge thousands of nodes that share the same Workpackages or Labels (i.e. business domains)
- represent business domains by nodes that have new shapes (rectangles for labels and triangles for workpackages) and custom colors with aggregated number of files and lines of code.
- visualize the interactions between the different parts (i.e. business domains) of the application
- understand the applications and domains dependencies at a glance.
We received a great feedback 🎊 from dozens of AWS Blu Age Certified users that have relied on this feature to speed up the assessment phase. We will be happy 😄 to hear from all of you as well!